Focus on Agriculture · October 2026
More food from every kilogram of nitrogen. Farm emissions still above 1990.
Saving agriculture, saving the land: how innovation is building food security and better husbandry in Northern Ireland.
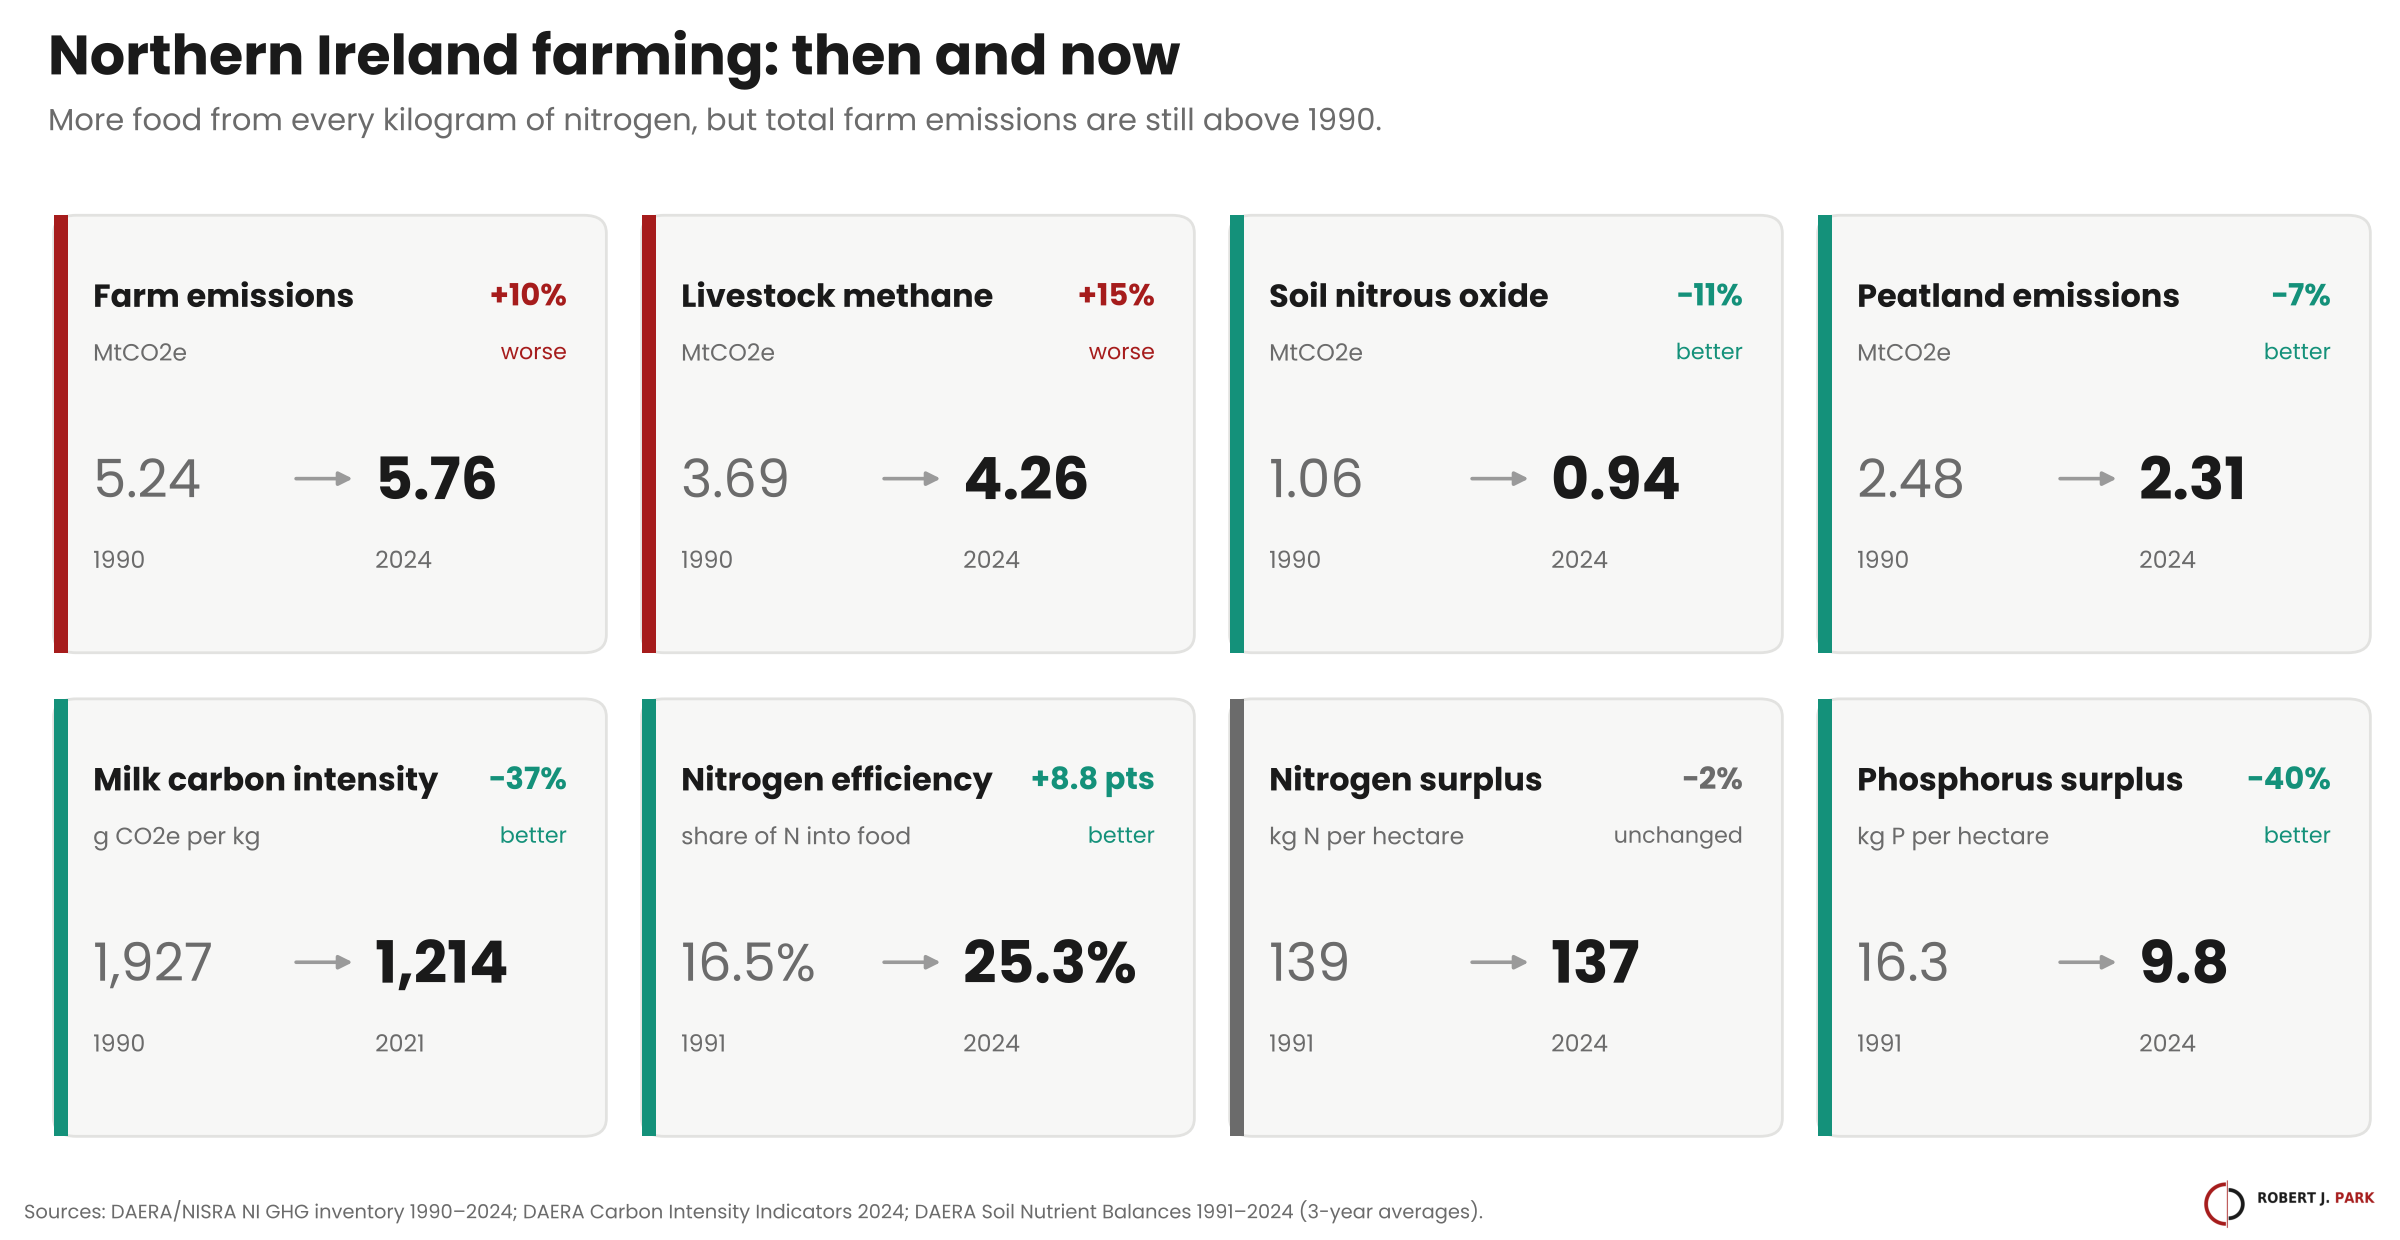
Northern Ireland farming produced 5.8 million tonnes of CO2e in 2024, 10% more than in 1990, while the rest of the economy cut its emissions by about 40%. That is the hard number. The better news sits underneath it: each kilogram of milk now carries 37% less carbon than in 1990, phosphorus surpluses have fallen by 40%, and over 540,000 fields have been soil-tested.
Sources and trendLivestock methane is now three-quarters of farm emissions
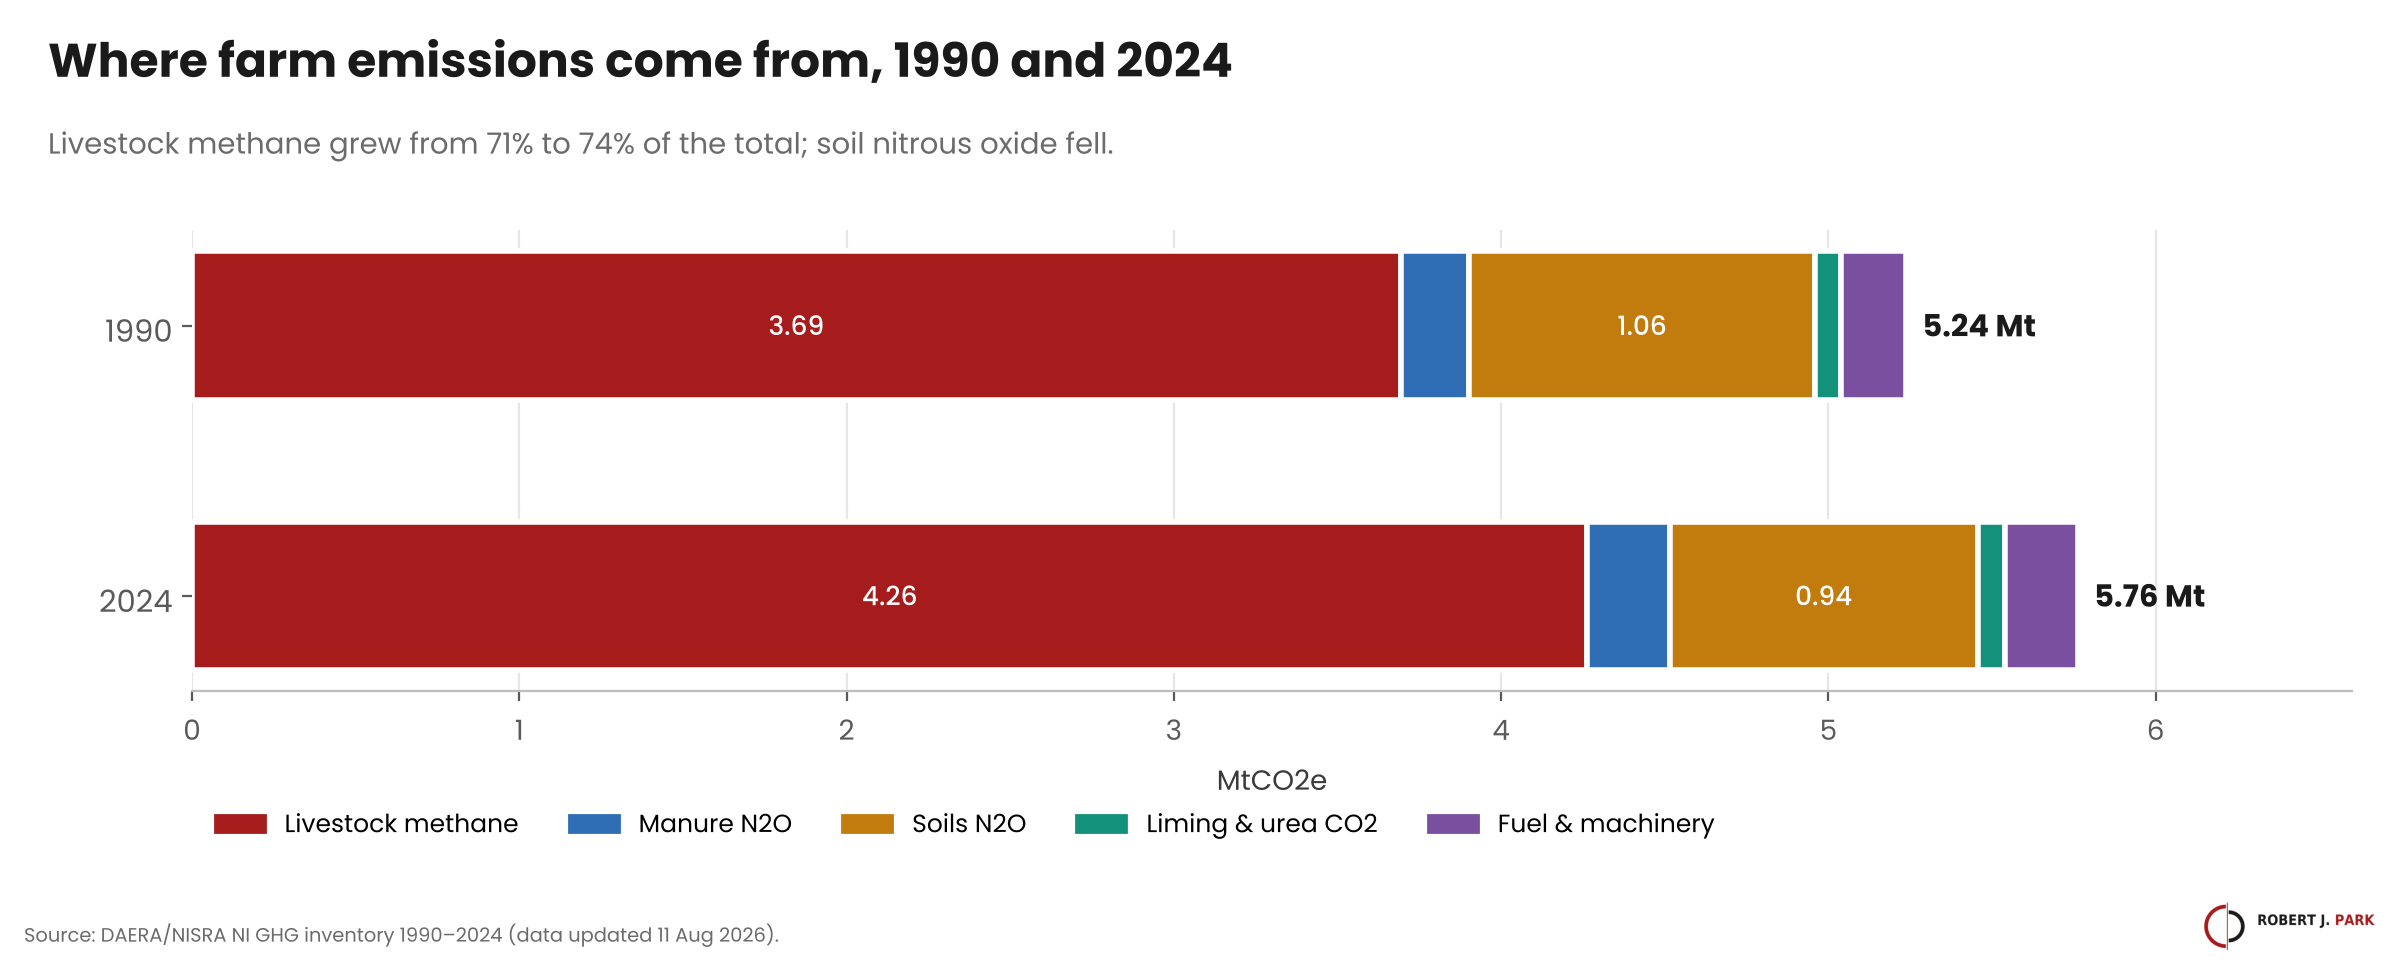
Methane from cattle and sheep digestion and manure has grown 15% since 1990 and now makes up 74% of farm emissions. Nitrous oxide from soils, driven by fertiliser and manure spreading, fell by 11%.
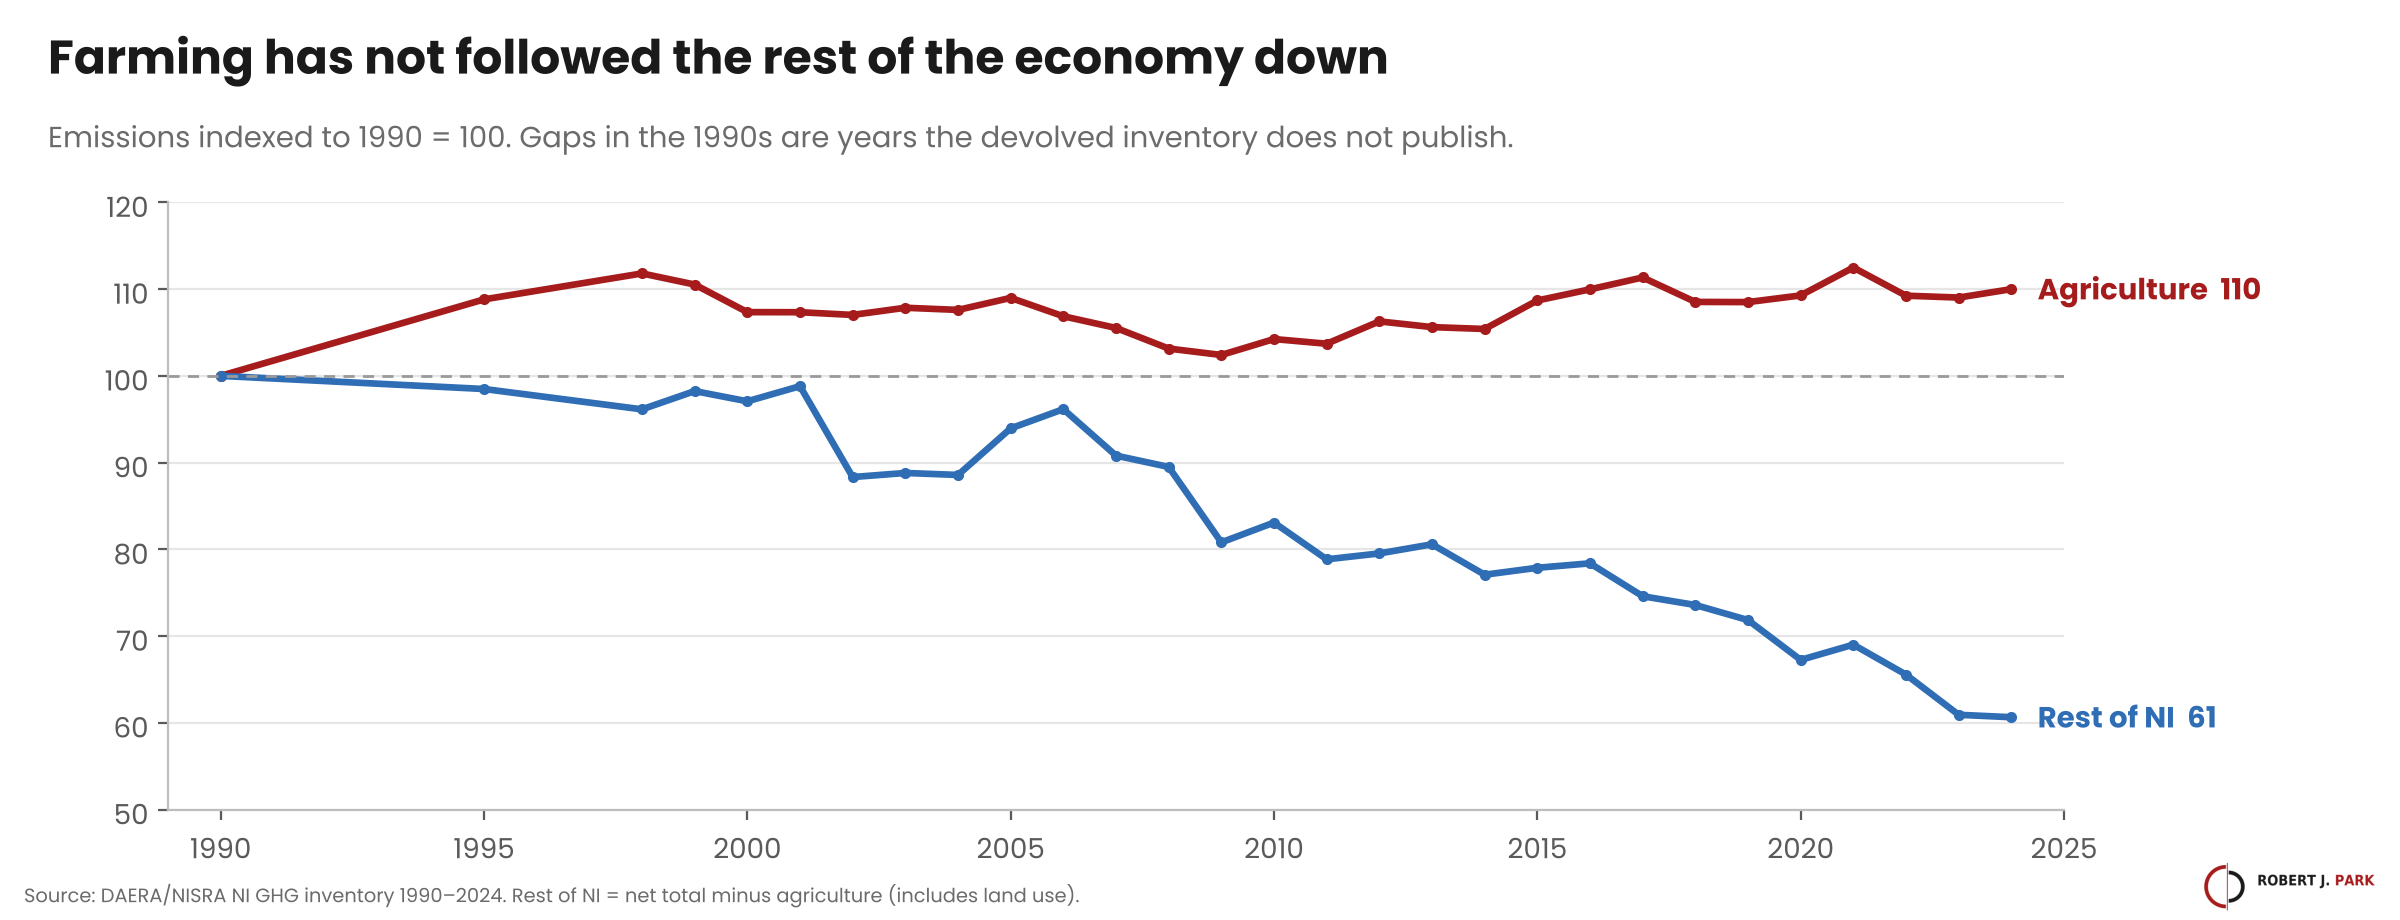
Farming has held roughly level while the rest of Northern Ireland’s emissions fell by about two-fifths. That gap is why agriculture now decides whether NI meets its carbon budgets.
Fertiliser and nutrientsFarms turn far more nitrogen into food, but the surplus has barely moved
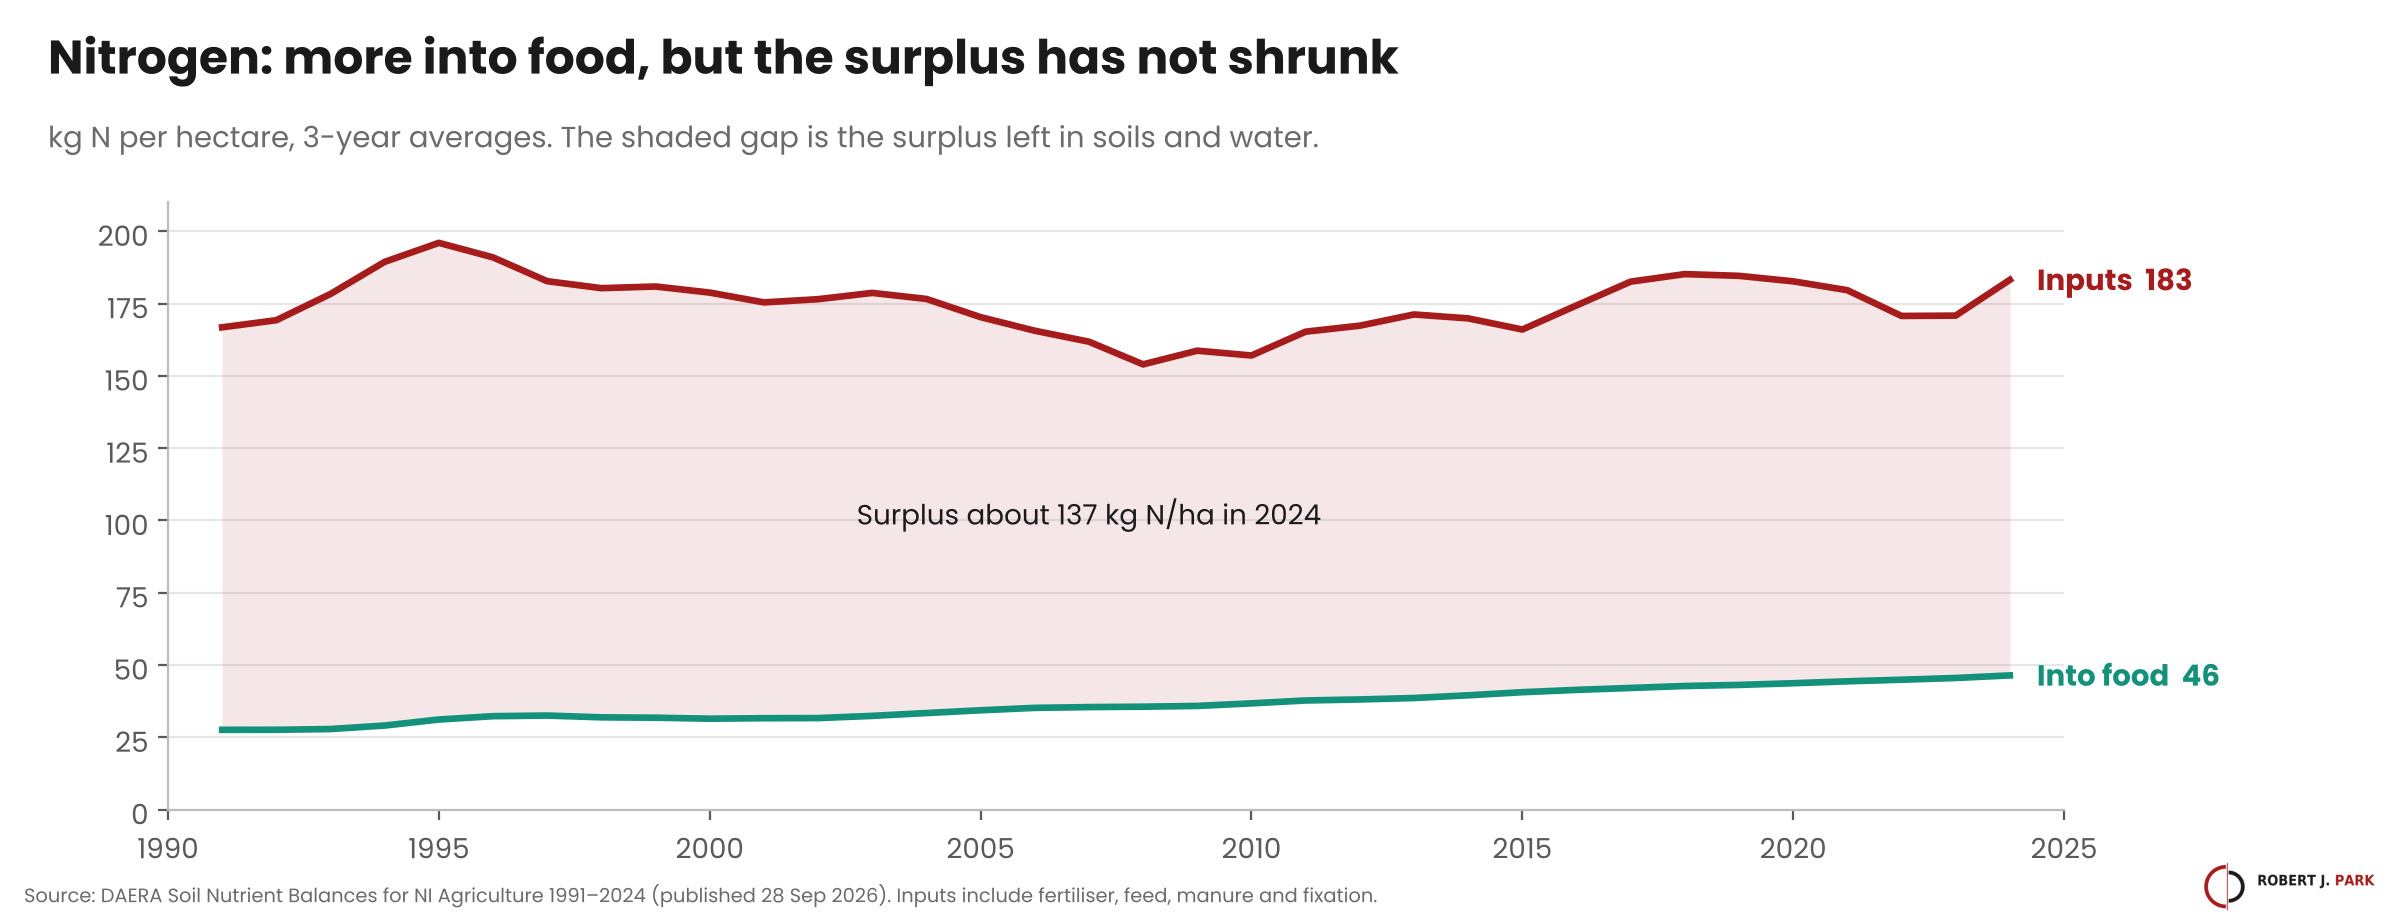
- DAERA’s new soil nutrient balance shows nitrogen leaving farms in produce up 68% per hectare since 1991, while total nitrogen inputs rose 10%. The surplus is unchanged at about 137 kg N per hectare.
- Phosphorus is the success story: inputs down 12%, surplus down 40%. That matters for Lough Neagh.
- Inputs jumped in 2024 (183 kg N/ha against 171 the year before), and farmers bought 20% more fertiliser in 2025. Both point the wrong way for nitrous oxide and water quality.
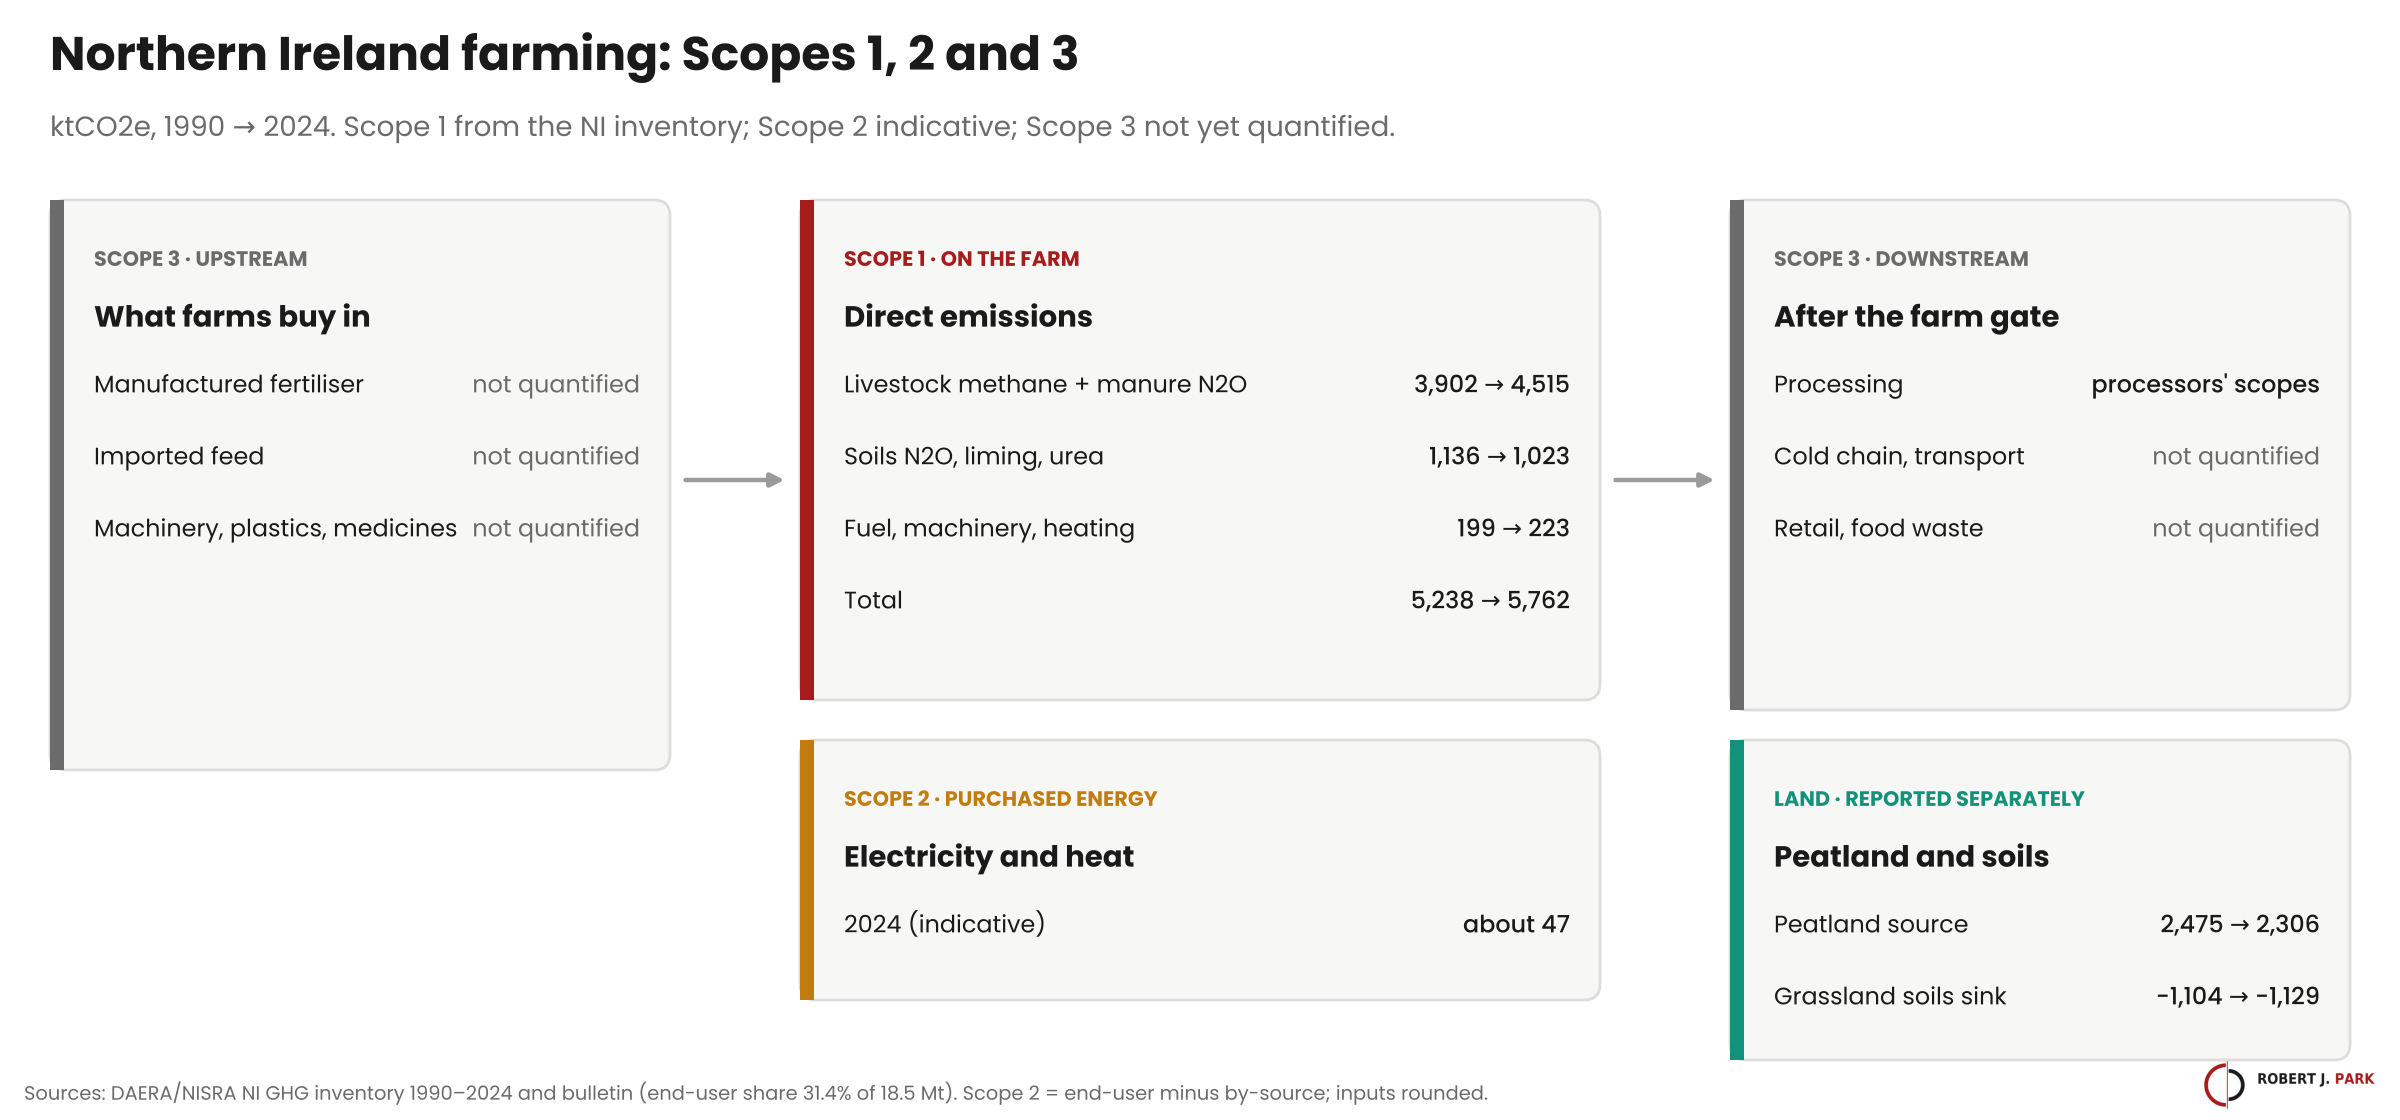
Scopes 1, 2 and 3What NI farming emits, buys in and passes on
Scope 1 is what happens on the farm. Scope 2 is electricity and heat bought in. Scope 3 is everything upstream and downstream: fertiliser, feed and machinery bought in, and processing after the farm gate. Only Scope 1 is fully measured today.
Saving the landPeatland restoration is now funded and planned
- Peatland. The Peatland Strategy Delivery Plan (22 April 2026) puts 4,500 ha on the road to recovery by December 2027, towards 150,000 ha restored by 2050. The cross-border PEAT+ project (€19.2m, 19 sites) launched in February.
- Woodland. Forests for Our Future had created 2,016 ha by the end of 2025: 22% of its 9,000 ha target for 2030.
- Soils. Grassland soils remain a net sink of about 1.1 MtCO2e a year, and the Soil Nutrient Health Scheme gives each farm a carbon estimate for its soils and hedgerows.
Innovation in husbandryNew research capacity arrives at Hillsborough in 2028
AFBI’s Ruminant Emissions Research Facility will test diets, slurry additives, flooring and genetics from 2028. Queen’s University’s ARCZero showed two of seven farms already net negative once hedges, trees and soils are counted. Methane-inhibiting feed additives such as 3-NOP cut methane by 25–30% in beef trials, and DAERA’s Beef Carbon Reduction and Suckler Cow schemes reward younger finishing and tighter calving.
SecurityIncomes recovered, but farms remain exposed to imported inputs
Total income from farming rose to £1.03bn in 2025, from £736m in 2024. Fertiliser and lime spending rose 32% to £133m. Precise nutrient plans are both a carbon and a cost measure: every unneeded tonne of nitrogen avoided protects margins against the next price spike, and UK CBAM will reach fertiliser imports from 1 January 2027.
Policy and deadlinesNI is behind its first carbon budget
| When | What | Who it affects |
|---|---|---|
| 31 Dec 2026 | ESOS phase 4 qualification date | Large agri-food businesses |
| 1 Jan 2027 | UK CBAM starts, including fertiliser imports | Fertiliser importers; costs pass to farms |
| 30 Sep 2027 | First EU CBAM declaration for 2026 imports | EU importers; NI supply chains |
| 31 Dec 2027 | End of NI’s first carbon budget (average 33% cut required; about 29.4% so far) | All sectors, agriculture most |
This monthThree things a farm can do
- Register for the Soil Nutrient Health Scheme if you have not yet done so, and book the CAFRE training it requires; it is a condition of the Farm Sustainability Payment.
- Plan spring nitrogen from your soil results: lime first, then only the N, P and K each field needs. Consider protected urea and clover-rich swards.
- Get a whole-farm carbon baseline (Scopes 1, 2 and 3) so hedges, trees and soil carbon count alongside emissions.
Is your farm ready to report?
The free Farm Carbon Data Checker lists the records a Scope 1, 2 and 3 report needs, tells you where to find each one in Northern Ireland, and shows the gaps to fill first. It takes ten minutes and nothing leaves your browser.
See the numbers behind this briefing
The NI Agriculture and Land Carbon dashboard sets out every figure used here: emissions by source from 1990 to 2024, nutrient balances, livestock, land use, F-gases, the Scope 1, 2 and 3 split, mitigation measures and research. Each table can be downloaded as a CSV.
The full briefingRead Focus on Agriculture, October 2026
The full seven pages, with the then-and-now table, the research programmes and every source.
SourcesWhere the figures come from
- NI greenhouse gas inventory 1990–2024 (DAERA/NISRA)
- NI GHG statistical bulletin 1990–2024
- Soil nutrient balances for NI agriculture 1991–2024 (DAERA)
- NI Carbon Intensity Indicators 2024
- June Agricultural Census 2025
- Livestock in NI, 1995 (CAIN)
- Agricultural incomes 2025 (DAERA)
- Peatland Strategy Delivery Plan (NIEL)
- PEAT+ launch (ABC Council)
- Forests for Our Future progress (Agriland)
- Soil Nutrient Health Scheme (AFBI)
- Ruminant Emissions Research Facility (AFBI)
- ARCZero (Farmers Weekly)
- Feed additive research (Irish Farmers Journal)
- Sustainable Agriculture Programme (Farmers Weekly)
- Electricity and renewable generation, year to June 2026 (DfE)
Focus on Agriculture is a monthly briefing by Robert J. Park, an independent environment, carbon and public-affairs consultant based in Larne, Northern Ireland. Robert helps farms, agri-food businesses and councils build carbon inventories, plan CBAM and reporting obligations, and make the case for land and peatland restoration.
Get in touch on LinkedIn or WhatsApp @robertjpark.